


Customers perform temperature mapping to generate the temperature profile of their facility. Inadequately controlled environments can lead to ineffective products or product loss. Both Health Canada and the FDA require temperature mapping to comply with their regulations.
“Monitoring of storage facilities is conducted at points representing the worst case scenarios of the temperature range based on temperature mapping.” – Guidelines for Temperature Control of Drug Products during Storage and Transportation, GUI-0069 Health Canada
It’s easy to feel daunted by this exercise. This is why our experts have put together this three-step approach for you.
Step 1: Protocol Writing
Choosing the Perfect Moment
Life is all about timing, and temperature mapping is no exception. You should perform temperature mapping in all storage areas during the coldest week of winter and the warmest week of summer. This increases the probability that such storage areas will remain within temperature limits at all times throughout the year.
To identify those weeks, look at historical temperature data in your area. Websites such as Environment Canada are a reliable source of data.
Logger Distribution
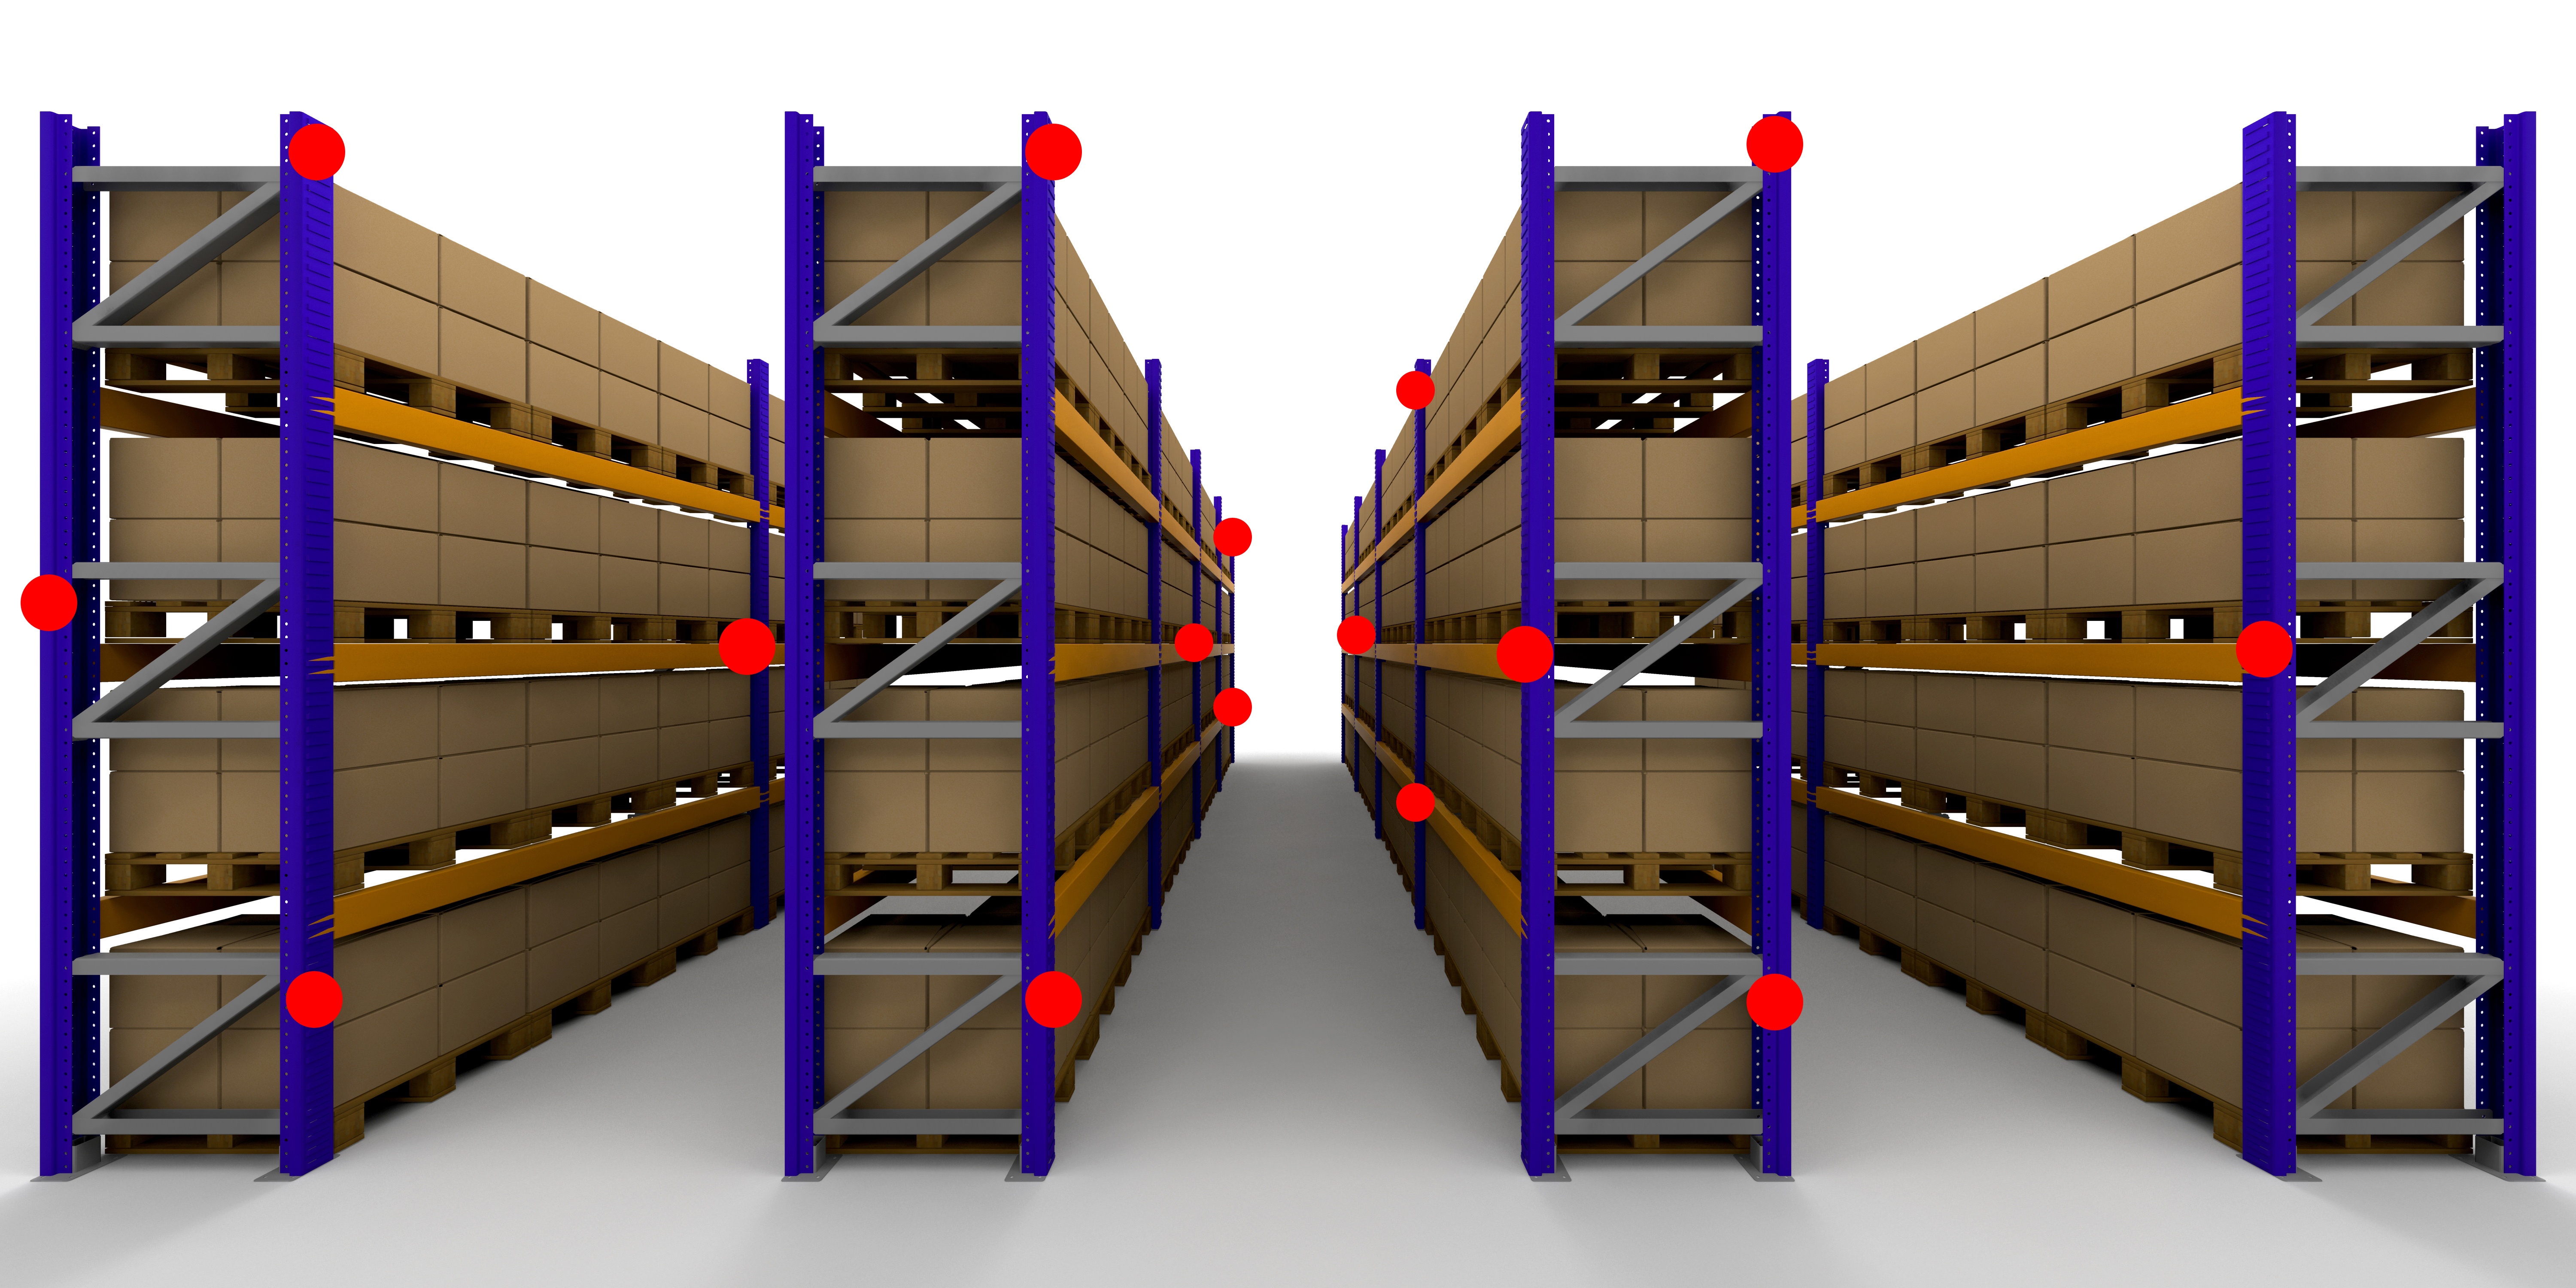
There is no set formula for the number or placement of data loggers that should be used for a mapping study. However, your study must demonstrate 3-dimensional uniformity and compliance with your product requirements. Using a 3-dimensional temperature profile means installing data loggers on at least three planes – top to bottom, left to right and front to back.
Add data loggers where known cold or warm areas exist and in all potentially problematic or critical locations. Such areas might include loading docks, in places affected by solar heating from windows, near HVAC units, and where there is uneven building insulation.
Duration
The total duration of the temperature mapping study must capture enough data from the system’s operations to demonstrate consistent and repeatable operation. The study must also capture events considered “worst case” scenarios of the temperature range.
On average, a temperature mapping study lasts 7 days.
Discover the two other elements to include in your mapping protocol here.
Step 2: Protocol Execution
Program & Install loggers
To perform the study, you will need to program calibrated data loggers using an FDA code 21 CFR part 11 compliant software. To reduce the risk of error, make sure to enter each data logger’s identification number in the “Description” field. Once this is done, physically label the data logger with the same ID number.
Once you are ready to execute the temperature mapping, install the data loggers as per the floor plan in your protocol. Just keep in mind that the locations and heights are approximate and might need some adjustments once on site.
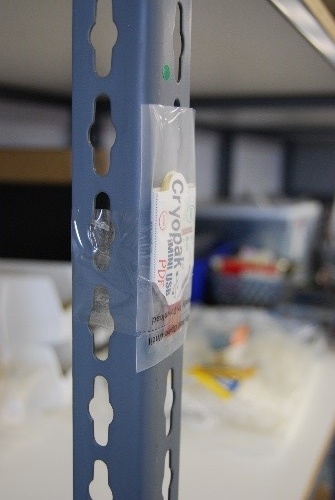
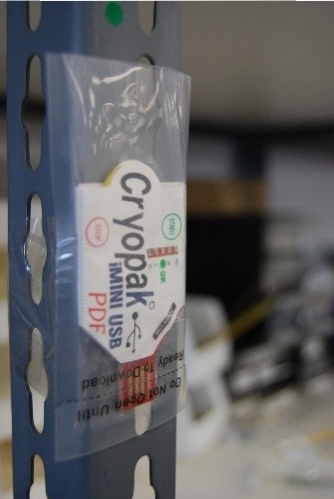
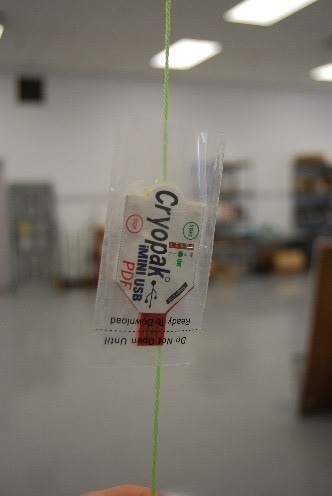
Finally, secure the data loggers in place. Make sure they will stay put during the study. Attach them to stationary objects such as shelves, or racks. Please refer to the pictures below for suggestions. In case of large empty spaces, you can install data loggers on ropes hanging from the ceiling.
Documentation
It’s very important to properly document every section of the warehouse in your protocol. Make sure to record all relevant information and discuss any unusual observations that might affect the study. Sign and date any change to the protocol.
Download Data
If you are using our iMiniUSB pdf data loggers, simply connect the data loggers to a USB port on your computer. Save the .pdf and .csv files.
If you are using a different type of data logger, follow the manufacturer’s specifications to download the data.
To read more about protocol execution, click here.
Step 3: Mapping Report
Compile data
Once the study is over, download the data from the iMiniUSB pdf by connecting the units to your computer. Save the original PDF files on a CD or other storage device. Keep this device with the original copy of your protocol, signed and documented, for future audits. Also, make sure to write down the name of the software used to retrieve the data. Once this is done, export data into an Excel spreadsheet for additional analysis.
Analyze data
Your Excel data and graphs become an integral part of your temperature mapping report, as they identify any undesirable temperature patterns. If any problems arise from the mapping study, you can take a wide range of measures to address them:
- Remove products from specific problem areas (such as hot spots near ceilings)
- Change work habits (such as keeping doors closed at all times)
- Modify racking or shelving configuration
- Install curtains or laminar flow devices
The analysis should also identify the most vulnerable spots in the storage areas, commonly known as the hot and cold spots. Once these locations have been identified, you should install real-time monitoring sensors in these areas to provide added reassurance that the conditions match the product storage specifications at all times.
To read more about mapping reports, click here.
